Dive into your data. Standard reports make it easy to measure and understand engagement on your site. Plus it only takes a few clicks to quickly build out customized reports, visitor segments, and identify important data to share with your team.
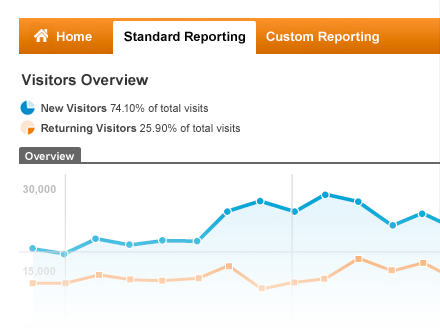
See how many people are on your site right now, where they came from, and what they're viewing. With Real-Time, you'll know whether new content on your site is popular, whether today's promotion is driving traffic to your site, and you can see the immediate effects of tweets and blog posts.

Build your own metrics dashboard in minutes. Instead of wading through data, you have instant access to the answers you need. Create reports to share with your colleagues and surface the insights that need to be shared.
Custom variables help you to understand your customer segments and learn how engaged they are with your site. Custom variables let you customize Google Analytics and collect the customer data that’s most important to your business.
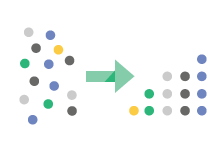
Why do some visits result in a $150 sale while others don't? You can find out, using Advanced Segments. Apply predefined segments such as "Visits with Conversions" or "Organic Traffic", or create your own segments. Analyze individual segments or compare a number of segments across all your reports.
Start with an overall “Company KPIs” dashboard that includes the most important performance indicators for your organization. Create an “SEO” dashboard for your search engine optimization. All dashboards are drag and droppable, completely widget-based, and highly customizable.

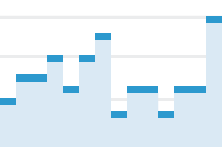
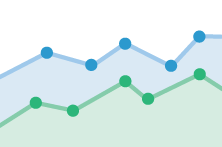
Google Analytics offers a variety of powerful visualization tools including Flow Visualization and In-Page Analytics. Flow Visualization reports analyze the path a visitor takes on your site. While In-Page Analytics helps to visually assess how users interact with your pages. To make your analysis easier we have built in a variety of charts to display information in the way you want to see it.
Data driven decision making works best when your teams can easily share information. Sharing tools in Google Analytics lets your keyword buying team work seamlessly with your SEO and content teams. Use the Intelligence and Alerts feature to discover unexpected changes and notify your colleagues. Mark key events in your account history for others to see. Easily develop and share custom dashboards for the metrics important to your business.

Applications, plugins, and customizable features are available to help you integrate Google Analytics into your organization’s workflows. Take advantage of third-party solutions, or create your own apps using the Google Analytics API.
